Rainy Day Index 2026 · Liverpool
Liverpool ranks fourth of ten British cities for rainy days where children live
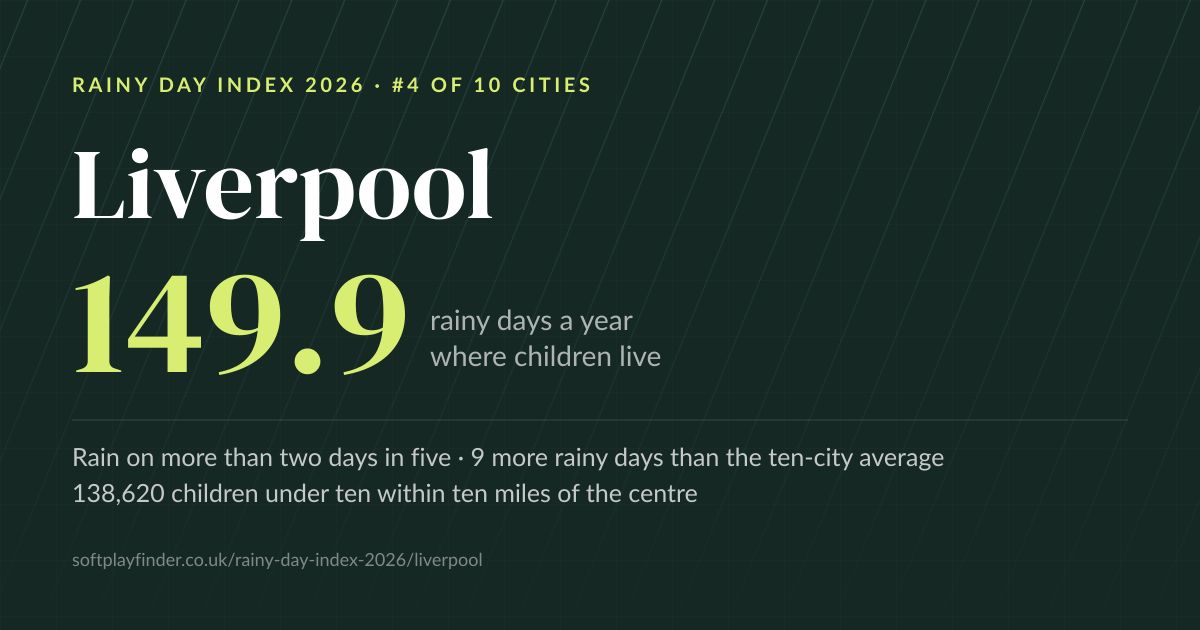
Children in the Liverpool area live with 149.9 rainy days a year, 9 more than the ten-city average, ranking fourth of the ten cities studied.
Liverpool in numbers
rainy days, 41% of the year
rainy days a year, 9 more than the ten-city average
within 10 miles of Liverpool city centre
By their tenth birthday, a child here can expect around 1,499 rainy days, 369 more than a child in London.
How Liverpool compares
Rainy days a year, ten cities.
- 01 Glasgow 174.2
- 02 Manchester 161.7
- 03 Cardiff 155.4
- 04 Liverpool 149.9
- 05 Bristol 137.6
- 06 Edinburgh 133.9
- 07 Leeds 132.4
- 08 Birmingham 131.8
- 09 Newcastle 124.0
- 10 London 113.0
Bars show the share of the year with at least 1 mm of rain, measured where children aged 0–9 live. Inside the Liverpool council boundary the figure is 152.0.
When it rains in Liverpool
Indoor play ideas nearby.
A few well-reviewed soft plays within 10 miles of the city centre. Check opening times before you go.
- Manu’s Wonderland Play Centre · 5.6 miles from the centre ★ 5 from 21 Google reviews
- Family and Friends Play Centre · 7.9 miles from the centre ★ 4.9 from 56 Google reviews
- Volair Adventure Cove Soft Play · 7.7 miles from the centre ★ 4.8 from 20 Google reviews
- Ninja Warrior UK Adventure Park (Liverpool) · 6.1 miles from the centre ★ 4.7 from 855 Google reviews
- Cub and Calf Parent Hub Limited · 8.3 miles from the centre ★ 4.7 from 107 Google reviews
- Slimeville Kids Playground · 0.6 miles from the centre ★ 4.6 from 131 Google reviews
For journalists
Using these figures
The graphic and figures on this page may be reproduced with credit to Soft Play Finder and a link to this page. The full ranking, method and data are on the main study page.
