Softplayfinder research · 2026
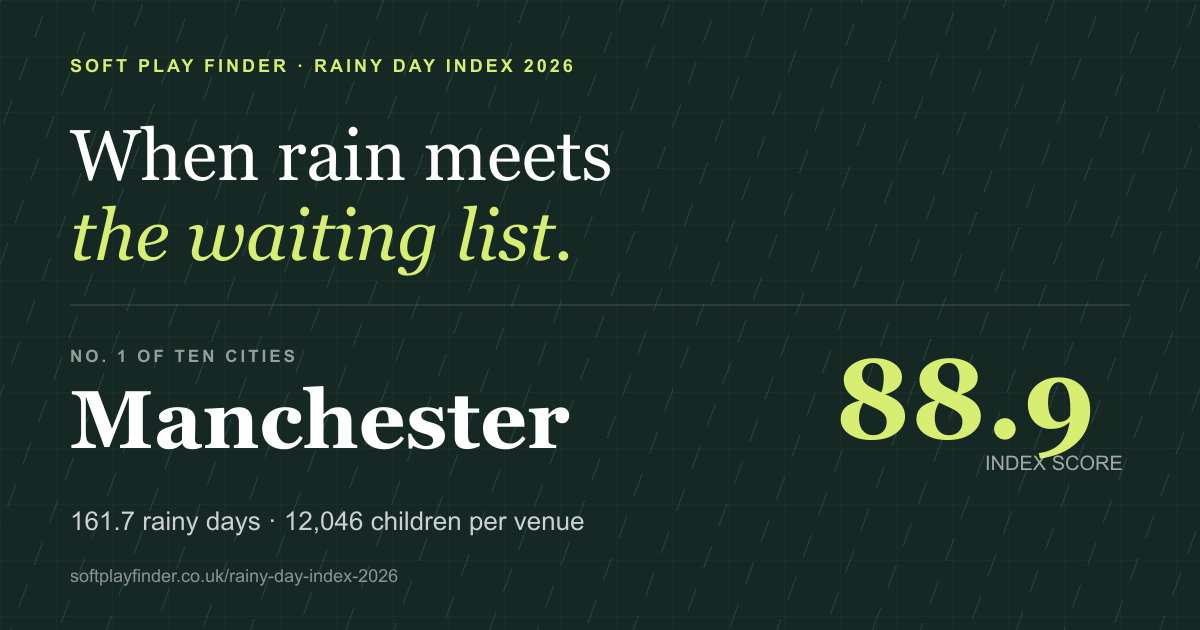
When rain meets
the waiting list.
We combined three decades of rainfall, the number of young children and the soft plays families can reach to find the toughest rainy-day cities.
Manchester named toughest of ten major British cities for rainy days with young children
The ranking
Two pressures.
One score.
A high score means a city is both wetter and has more children competing for each venue. Scores compare these ten cities—not every UK town.
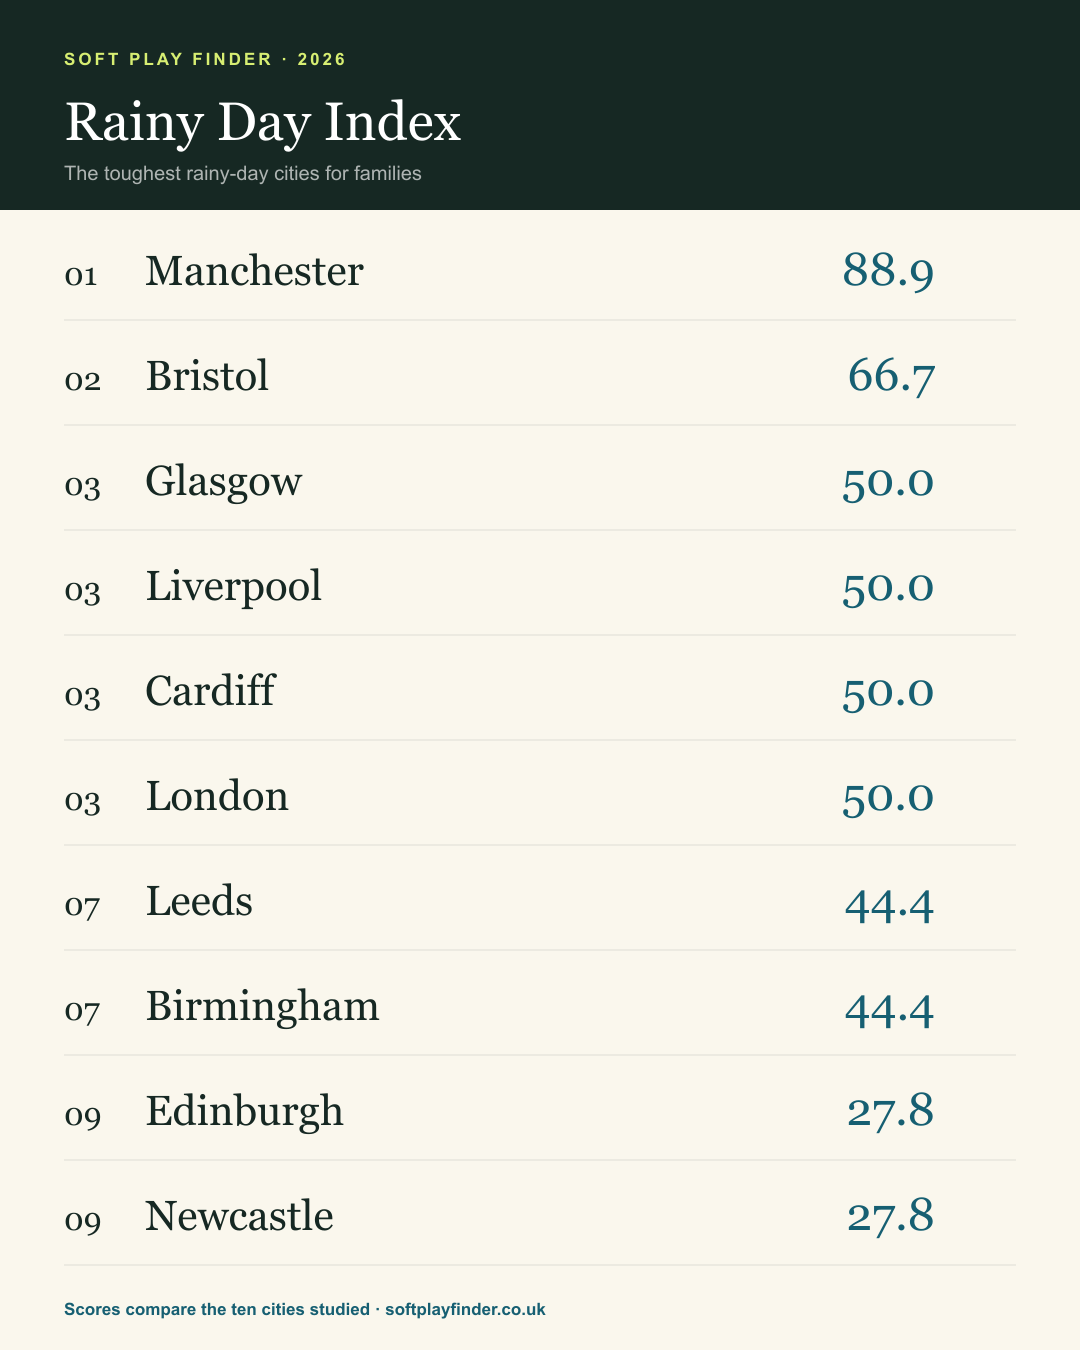
Download the results- 01 Manchester
Rain 88.9 · Supply pressure 88.9
88.9 - 02 Bristol
Rain 55.6 · Supply pressure 77.8
66.7 - 03 Glasgow
Rain 100.0 · Supply pressure 0.0
50.0 - 03 Liverpool
Rain 66.7 · Supply pressure 33.3
50.0 - 03 Cardiff
Rain 77.8 · Supply pressure 22.2
50.0 - 03 London
Rain 0.0 · Supply pressure 100.0
50.0 - 07 Leeds
Rain 33.3 · Supply pressure 55.6
44.4 - 07 Birmingham
Rain 22.2 · Supply pressure 66.7
44.4 - 09 Edinburgh
Rain 44.4 · Supply pressure 11.1
27.8 - 09 Newcastle
Rain 11.1 · Supply pressure 44.4
27.8
Why Glasgow isn't number one
Wettest doesn't mean toughest.
Glasgow gets more rainy days than any city in the study—but it also has the strongest venue provision. The index rewards the interaction between weather and available indoor play, not rainfall alone.
rainy days in Glasgow
venues per 10,000 Glasgow children
children per London venue
Ten cities studied
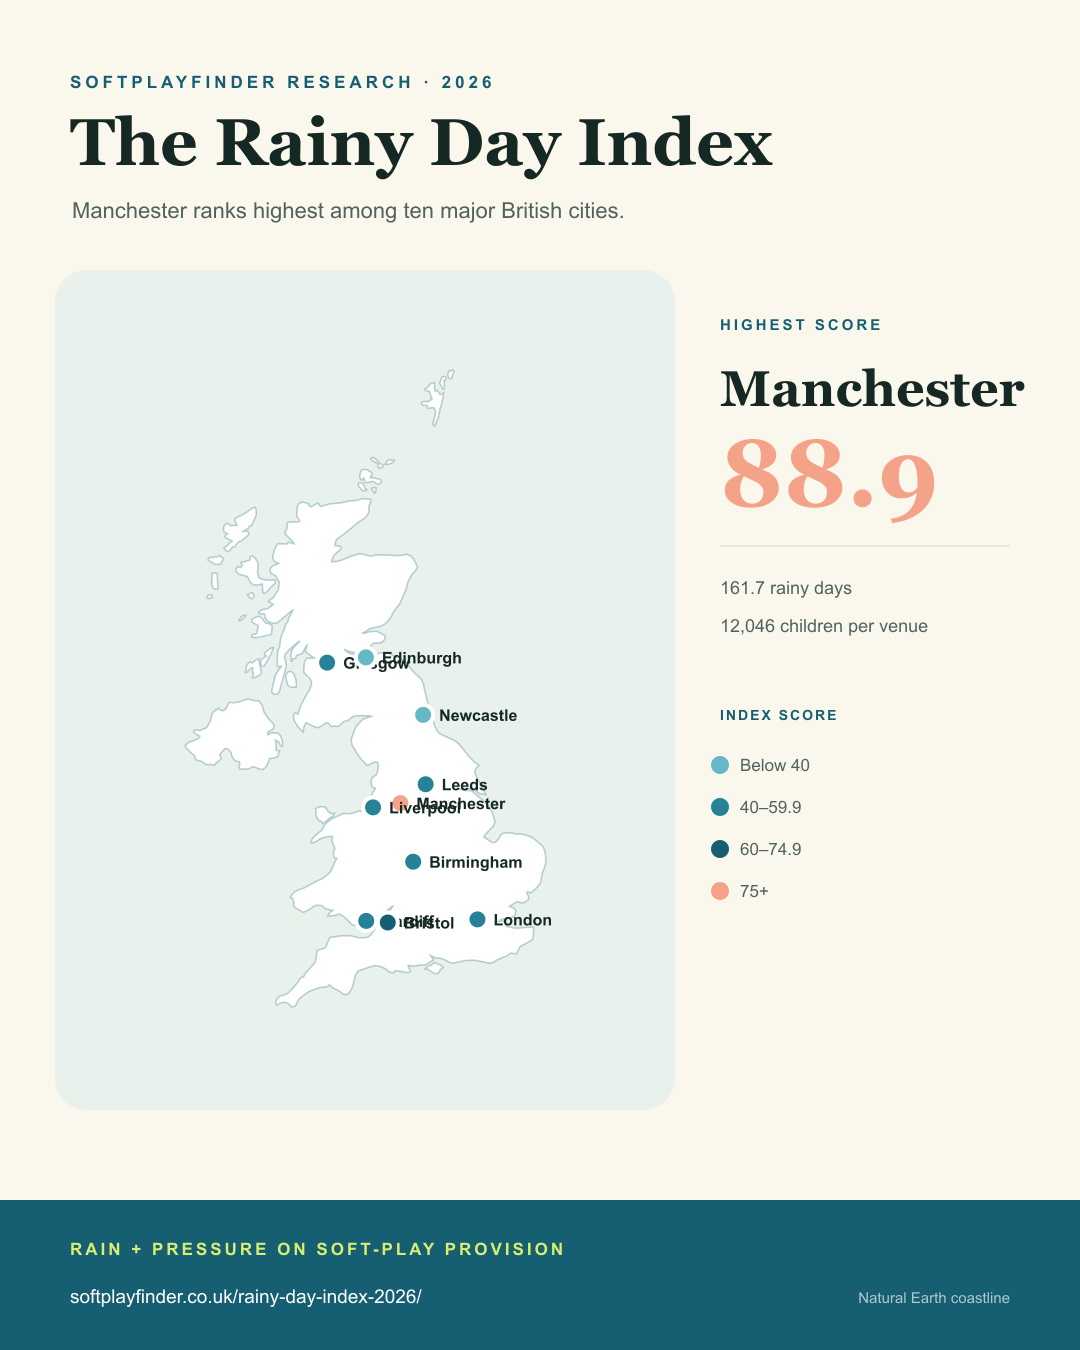
A rainy-day map of Britain.
Marker colour shows the combined Rainy Day Index score. Select any labelled city to compare its full result.
 Manchester88.9Bristol66.7Glasgow50.0Liverpool50.0Cardiff50.0London50.0Leeds44.4Birmingham44.4Edinburgh27.8Newcastle27.8
 City-centre positions on a Natural Earth coastline. The study covers ten selected British cities.
Selected city · Rank 1
Manchester
- Annual rainy days
- 161.7
- Children aged 0–9
- 289,099
- Published venues
- 24
- Children per venue
- 12,046
- Venues per 10,000 children
- 0.83
- Estimated venue shortage
- 0
Selected city · Rank 2
Bristol
- Annual rainy days
- 137.6
- Children aged 0–9
- 96,305
- Published venues
- 8
- Children per venue
- 12,038
- Venues per 10,000 children
- 0.83
- Estimated venue shortage
- 0
Selected city · Rank 3
Glasgow
- Annual rainy days
- 174.2
- Children aged 0–9
- 131,897
- Published venues
- 38
- Children per venue
- 3,471
- Venues per 10,000 children
- 2.88
- Estimated venue shortage
- 0
Selected city · Rank 3
Liverpool
- Annual rainy days
- 149.9
- Children aged 0–9
- 138,620
- Published venues
- 21
- Children per venue
- 6,601
- Venues per 10,000 children
- 1.51
- Estimated venue shortage
- 0
Selected city · Rank 3
Cardiff
- Annual rainy days
- 155.4
- Children aged 0–9
- 71,505
- Published venues
- 12
- Children per venue
- 5,959
- Venues per 10,000 children
- 1.68
- Estimated venue shortage
- 0
Selected city · Rank 3
London
- Annual rainy days
- 113.0
- Children aged 0–9
- 734,483
- Published venues
- 36
- Children per venue
- 20,402
- Venues per 10,000 children
- 0.49
- Estimated venue shortage
- 6
Selected city · Rank 7
Leeds
- Annual rainy days
- 132.4
- Children aged 0–9
- 180,744
- Published venues
- 21
- Children per venue
- 8,607
- Venues per 10,000 children
- 1.16
- Estimated venue shortage
- 0
Selected city · Rank 7
Birmingham
- Annual rainy days
- 131.8
- Children aged 0–9
- 288,912
- Published venues
- 31
- Children per venue
- 9,320
- Venues per 10,000 children
- 1.07
- Estimated venue shortage
- 0
Selected city · Rank 9
Edinburgh
- Annual rainy days
- 133.9
- Children aged 0–9
- 66,149
- Published venues
- 19
- Children per venue
- 3,482
- Venues per 10,000 children
- 2.87
- Estimated venue shortage
- 0
Selected city · Rank 9
Newcastle
- Annual rainy days
- 124.0
- Children aged 0–9
- 125,379
- Published venues
- 15
- Children per venue
- 8,359
- Venues per 10,000 children
- 1.20
- Estimated venue shortage
- 0
Index score
- Manchester: index 88.9, 161.7 rainy days, 24 venues, 12,046 children per venue.
- Bristol: index 66.7, 137.6 rainy days, 8 venues, 12,038 children per venue.
- Glasgow: index 50.0, 174.2 rainy days, 38 venues, 3,471 children per venue.
- Liverpool: index 50.0, 149.9 rainy days, 21 venues, 6,601 children per venue.
- Cardiff: index 50.0, 155.4 rainy days, 12 venues, 5,959 children per venue.
- London: index 50.0, 113.0 rainy days, 36 venues, 20,402 children per venue.
- Leeds: index 44.4, 132.4 rainy days, 21 venues, 8,607 children per venue.
- Birmingham: index 44.4, 131.8 rainy days, 31 venues, 9,320 children per venue.
- Edinburgh: index 27.8, 133.9 rainy days, 19 venues, 3,482 children per venue.
- Newcastle: index 27.8, 124.0 rainy days, 15 venues, 8,359 children per venue.
Rain vs provision
Every city tells a different story.
Longer bars mean more annual rainy days and more children per venue. Manchester is unusually high on both measures; London is an extreme supply story rather than a rainfall story.
Swipe to compare →
Full results
The numbers behind the weather.
Swipe for the full table →
| City | Rainy days | Children 0–9 | Venues | Children / venue | Venues / 10k | Child Rainy Days* |
|---|---|---|---|---|---|---|
| Manchester | 161.7 | 289,099 | 24 | 12,046 | 0.83 | 46,751,480 |
| Bristol | 137.6 | 96,305 | 8 | 12,038 | 0.83 | 13,251,450 |
| Glasgow | 174.2 | 131,897 | 38 | 3,471 | 2.88 | 22,979,553 |
| Liverpool | 149.9 | 138,620 | 21 | 6,601 | 1.51 | 20,778,207 |
| Cardiff | 155.4 | 71,505 | 12 | 5,959 | 1.68 | 11,114,566 |
| London | 113.0 | 734,483 | 36 | 20,402 | 0.49 | 82,991,714 |
| Leeds | 132.4 | 180,744 | 21 | 8,607 | 1.16 | 23,935,724 |
| Birmingham | 131.8 | 288,912 | 31 | 9,320 | 1.07 | 38,067,485 |
| Edinburgh | 133.9 | 66,149 | 19 | 3,482 | 2.87 | 8,858,705 |
| Newcastle | 124.0 | 125,379 | 15 | 8,359 | 1.20 | 15,541,097 |
* Child Rainy Days = annual rainy days × children aged 0–9. It provides scale context and is not part of the composite score.
Methodology
Fair comparisons, clear limits.
The headline uses an approximately ten-mile straight-line radius from each city centre because families cross council borders. Local-authority results were also tested: rainfall barely changed, while arbitrary borders materially changed venue access.
01How the index is calculated
The score equally weights each city's rainy-day percentile and children-per-venue percentile among the ten cities. Child Rainy Days is contextual and excluded from the score so population is not counted twice.
02Rainfall data
Annual days with at least 1 mm of precipitation come from the Met Office HadUK-Grid 1991–2020 climate normal at 1 km resolution. Results are weighted by where children live.
03Population and venues
Ages 0–9 use ONS Census 2021 TS007A in England and Wales and Scotland Census 2022 UV103. Venues are 429 quality-gated Soft Play Finder listings from the September 2026 analysis snapshot. The ten-city counts include every published venue within the same radius, regardless of its displayed metro label.
04What the study does not claim
This compares ten selected British cities, not every UK town. The shortage figure is a benchmark comparison—not a commercial viability forecast. Straight-line radius is reproducible but is not drive time.
05City centres and reproducibility
Fixed longitude/latitude points were used for Glasgow, Edinburgh, Manchester, Liverpool, Leeds, Birmingham, Bristol, Cardiff, Newcastle and London. Small-area child-population centroids were matched to the nearest HadUK-Grid 1 km cell, then population-weighted. The frozen rainfall file checksum and full reproduction sequence are retained with the analysis.
For journalists
The story, ready to use.
Download the release, graphics and underlying data. Graphics may be reproduced with attribution to Soft Play Finder and a link to this study.
“Rainy days are when families most need clear, local choices. These results show that weather is only half the story—the number of suitable places families can actually reach matters just as much.”